Page Performance
Interpret your page performance metrics and use them to optimize your content for better performance.
Page performance metrics
What is the date range for my page performance data?
The default date range is a year back from the previous day you’re checking, regardless of how long your page has been on Marketplace. Click the date picker and ‘Advanced’ to see options for predefined or custom date ranges
What are Key Metrics and how to use them?
Page Views is the total number of times your page has been viewed
Unique Page Views is an aggregation of page views generated by the same user during the same session. Therefore, a user with many page views to your page within the same session will only count as one unique page view.
Conversion rate is the number of unique page views divided by your total number of leads from the Contact Us, Book a Demo and Download forms
Contact Us Leads is the number of submissions of the ´Contact Us´ form.
Book a Demo Leads is the number of submissions of the ´Book a Demo´ form, if you have this activated on your page.
Download Leads is the number of submissions of the ´Download´ form.
Performance Development displayed for each key metrics:
- Increase (green) or decrease (red) compared to previous time period
- Best month shows the highest performing month within the selected time period
- Similar pages show your key metrics performance compared to pages similar to yours within the selected time period. This would typically be pages with several tags matching the tags used on your page
Key Metrics by month graph
This graph shows the development of your key metrics over the last 12 months. Left axis shows the number of pageviews and unique pageviews (Line) and the right axis shows your various leads (Bar). Colors matched with the key metrics scorecards above.
You can hover over the lines or bars to see the actual numbers for each month.
Visits by country
This section provides an overview of the countries your traffic comes from.
The geographical map shows which countries generates most of your unique pageviews. The countries generating the most unique page views are highlighted in blue. You can hover your cursor over a country on the map to see the number of unique pageviews for each country.
The traffic table lists the number of unique page views for each country and the number of page interactions (clicks on your page content, forms and video views) within each country.
This will provide an overview of which markets are most engaged with your content.
Visits by grouped traffic sources and most used traffic sources
The pie chart displays the percentage of total visits to your page divided by grouped traffic sources. The table provides an overview of the traffic sources your unique page views come from and the percentage of total unique pageviews for each source.
A grouped traffic source shows how the traffic came to your page and can contain a set of specific traffic sources that show where the traffic came from.
Traffic sources include:
- Organic Search: Traffic coming from the non-paid search results in search engines such as Google, Bing, Yahoo, DuckDuckGo, etc.
- Direct (or ‘None’): Visitors entering your page name directly in their address bar
- Paid search (CPC): Traffic coming from paid ads on search engines
- Display Ads: Traffic coming from ads on other websites
- Email: Traffic coming from email sources. For example, Pardot is the marketing automation tool from where Milestone sends out the monthly Milestone Business Update and other marketing emails to partners and potential customers
- Referrals: Traffic coming from other websites than milestonesys.com, for instance your own website, tech sites or Milestone subdomains such as the Milestone Support Forum
- Milestone referrals: Traffic coming from other pages on milestonesys.com
- Social: Traffic coming from Social Media channels such as LinkedIn, Facebook, Twitter etc.
- Other: Traffic that does not match any of the categories listed above
Content performance overview
This section provides an overview of how your page content performs. This will give you an indication of what topics and types of content your visitors are interested in and engage most with.
The types of content you will be able to see the performance of include:
- Clicks on tabs and content shares
Shows the number of clicks on tabs displayed on your page, print and social media share icons and the number of customer reviews or recommendations added to your page - Tag performance for your page
Shows how many page views each of your page tags send to your page. This indicates if users see the relevance between your tags and your specific product or service, which tags are most suitable as main tags, and what topics your page content should be optimized for - Tag performance for similar pages
Shows which Marketplace tags drive most page view to pages similar to yours, which would typically be pages with several tags matching the tags used on your page. This can indicate if there are other tags you could add to your page. Only add tags that are relevant for your specific product or service, as irrelevant tagging can have a negative impact on your page performance - Clicks on other content elements
Shows the numbers of clicks on other content elements on your page, e.g. clicks on videos, customer stories, links to pages similar to yours, links to your other pages or partners you have worked with, if these have been added. - Downloaded files
Shows which specific documents your visitors have downloaded
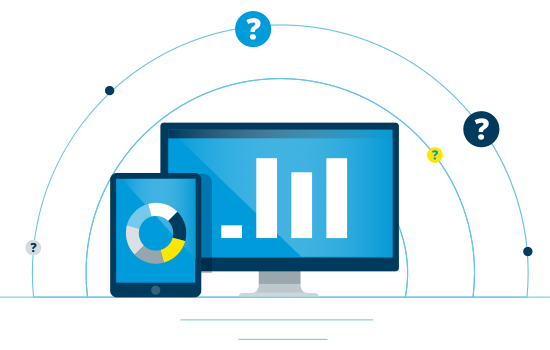
Ready to boost your marketplace performance?
Boost awareness, get quality traffic, convert hot leads.
Make your page stand out with a paid Marketplace Plan that delivers:
- Increased visibility
- Better ranking
- Page performance insights
- Page review sessions